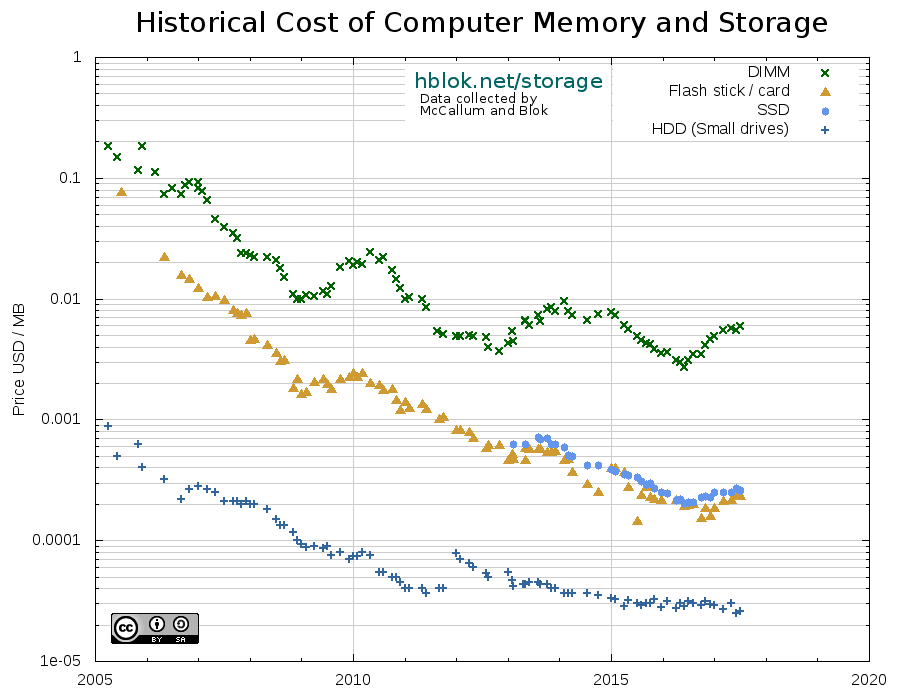
Historical Cost of Computer Memory and Storage
Last updated: 10 December 2017
Full history 1957 – present

(Click image for larger version)</p>
Recent history 2005 – present

Background
Computer storage, primary and secondary memory, has seen a tremendous phase of development over the last fifty years. As new technology has been brought to the market prices have continued to decline steadily at a logarithmic scale. For magnetic storage, the trend has been very stable over the last thirty years, with prices per MB going down around a third every year, or a ninety percent every five years. For primary storage, the trend has been more volatile, but overall we see a similar rate of decline all the way back to the first flip-flops in the 1950s.
John C. McCallum has done an excellent job in collecting all the data over the years, going back to computer magazines for reference. I’ve continued this work, and published the data and graphs here. Most of the data prior is collected by McCallum, with some points after January 2013 added by myself (the source is marked in the data files linked below). For McCallum’s original data sets, see his web site [magnetic, memory, flash].</p>
Methodology
Following McCallum’s example, I’ve continued to use the “lowest priced [items] for which I could find prices at the time”. Over the last years, the main source has been the USD price at NewEgg.com. Their, prices are generally stated free of shipping charges, but sometimes with “rebates”, which is probably more marketing than a special reduction in price. A new price point is added every one or two months.
For RAM, capacity is counted in MiB (1024 * 1024 bytes, base 2), since that still reflects the nature of that medium. However, for harddisks (spinning and solid state) now up in multiple tera bytes this no longer makes sense. Harddisk platter density is not measured in MiB, but rather MB (1000 * 1000 bytes, base 10), and is also sold by that unit; thus a 3 TB harddisk can be expected to store 3×1012 bytes, rather than 3×240 = 3.3×1012 bytes. Of course, when calculating cost per MB, base 10 is always used. The raw data files make this clear.
Raw data and Gnuplot script
If you would like to investigate the details of the data, or reconstruct the graph, the raw data files and Gnuplot script are available here.
disk_magnetic.csv [HTML]
memory.csv [HTML]
ssd.csv [HTML]
flash.csv [HTML]
License
McCallum’s original copyright notice was simply “You can use the contents here. Please acknowledge the source”.
I’ve used the Creative Commons License with the Attribution and ShareAlike sections, in the hope that the data and chart will continue to exist in open form. Thus, the data, Gnuplot script and chart are licensed under the Creative Commons Attribution-ShareAlike 3.0 Unported License.

Creative Commons Attribution-ShareAlike 3.0 Unported License.
</div>